Postings on science, wine, and the mind, among other things.
Buying Wine from the Back Label
Using data to decipher winemakers' language
]")
Buying wine can be fraught activity for many people. The cost of wine makes exploring its variety an expensive hobby and the unfortunate snobbishness that surrounds wine connoisseurship can easily become off-putting. In this respect - as in many others - I had good fortune in my parents, who are both wine microbiologists in the Department of Viticulture and Enology at California State University Fresno. Through them I learned a great deal about wine - tasting, science, and industry - that would otherwise have been difficult to come by. We've even published a paper together!
However, even people considerably more entrenched in the wine world than I can struggle to keep track of the vast number of wineries and brands on the market. California alone now boasts over 3,500 wineries, to say nothing of the rest of the world. So how is the average consumer supposed to make intelligent choices in the face of this avalanche of options? In an ideal world, one might research wineries, read expert opinions, and sample broadly, but often one might find oneself staring down the store wine rack with just the bottles, the prices, and a pressing need to bring home some palatable wine.
The analyses below use data from Wine.com, the biggest online wine retailer in the United States, to offer guidance that you can take forward with you to the next time you're in such a situation. Through the Wine.com API, I was able collect extensive data on over 75,000 wines sold (or previously sold) on the site. As the title of this article suggests, the focus of the results presented here will be the back label, or more specifically the "winemaker's notes" that accompany most bottles. I use quotes to refer to these notes because in reality they are often at least as much a product of a winery's marketing team as of the winemaker's perception. Given that these notes are meant to cast the wine in the best possible light, what signs can we watch for that might betray particularly low or high quality? Read on to find out!
How to measure quality?
Measuring the quality of a notoriously subjective good such as wine presents many challenges. Outside of outright spoilage, there's rarely a clear right or wrong answer when it comes to wine. While social influence certainly helps shape preference, this does not negate the role of personal taste. If you like a wine, no one should convince you otherwise! That said, we'll concern ourselves here with two measures of quality: consumer preference and professional ratings.
Wine.com provides ratings of its community members and professional ratings from well-known sources such as Wine Spectator and Robert Parker's Wine Advocate. The former are made on the type of 5-star scale familiar to any online shopper, while the latter consist of points on a nominally 50-100 scale. Professional reviews suffer from severe inflation, however, and in reality 99.999% of wines listed had a score of 85 or above. The basic goal here is to associate high (or low) scores on these two measures of quality with specific terms used in winemaker's notes.
Before we get started with that, however, let's first take a chance to examine these two measures of quality and how they relate to another key determinant of wine purchasing decisions: price. For each wine, I took its minimum national price and converted it to percentile rank (i.e. the most expensive 1% of wines would be 99th percentile, or .99 on the following graphs). I used this transformation for two reasons: first, because it deals with the problematic skewness of the price data, and second, to obfuscate the real numbers from Wine.com to prevent malicious use of this data by competitors. All visualizations below were produced in R.
Price and community ratings
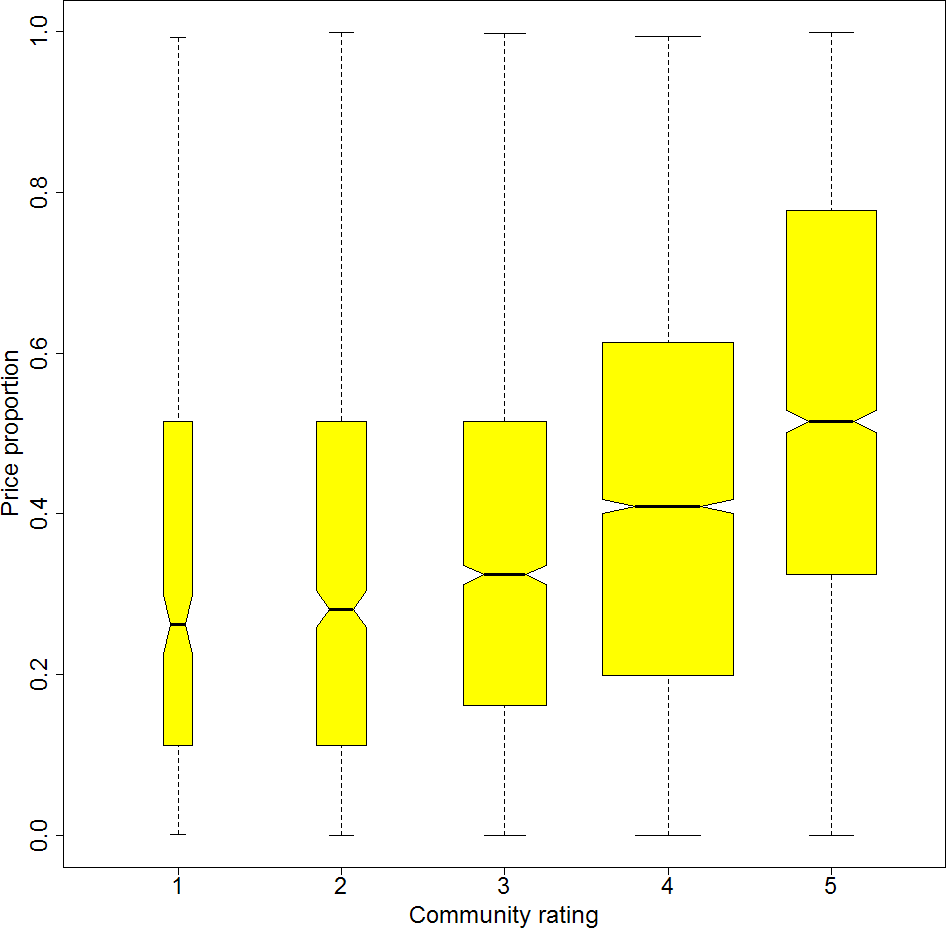
The box plots above show the distribution of price as a function of community ratings (1-5 starts). For those of you unfamiliar with box plots, the yellow shaded region indicates where the middle 50% of data points fall, the horizontal black line in the center indicates the median, and the 'whiskers' extending from the box indicate data points within 1.5x times interquartile range from the box. Note that the whiskers are largely useless here because of the restricted range. The width of the boxes is proportional to the square root of the number observations in that category, and the size of the 'notch' or indentation around the median indicates a rough confidence interval for the median. The price proportion on the y-axis is again the percentile rank (with 1.0 indicating the highest wine prices, and 0.0 indicating the lowest prices).
As the data clearly show, highly rated wines are also more expensive, particularly those with 4-5 star average community reviews. Of course, the direction of causation is here open to interpretation. The classic economic interpretation of these data would suggest that the certain wines are more expensive because they are actually preferred, and therefore in higher demand. However, an fMRI study in PNAS suggests that orbitofrontal cortex, a brain region associated with reward and valuation, changes its activity in relationship to the perceived price of wine rather than its actual price. Only a single pair of wines were considered in this study, but this at least hints that the high prices may elicit higher community reviews rather than the other way around.
Price and professional ratings
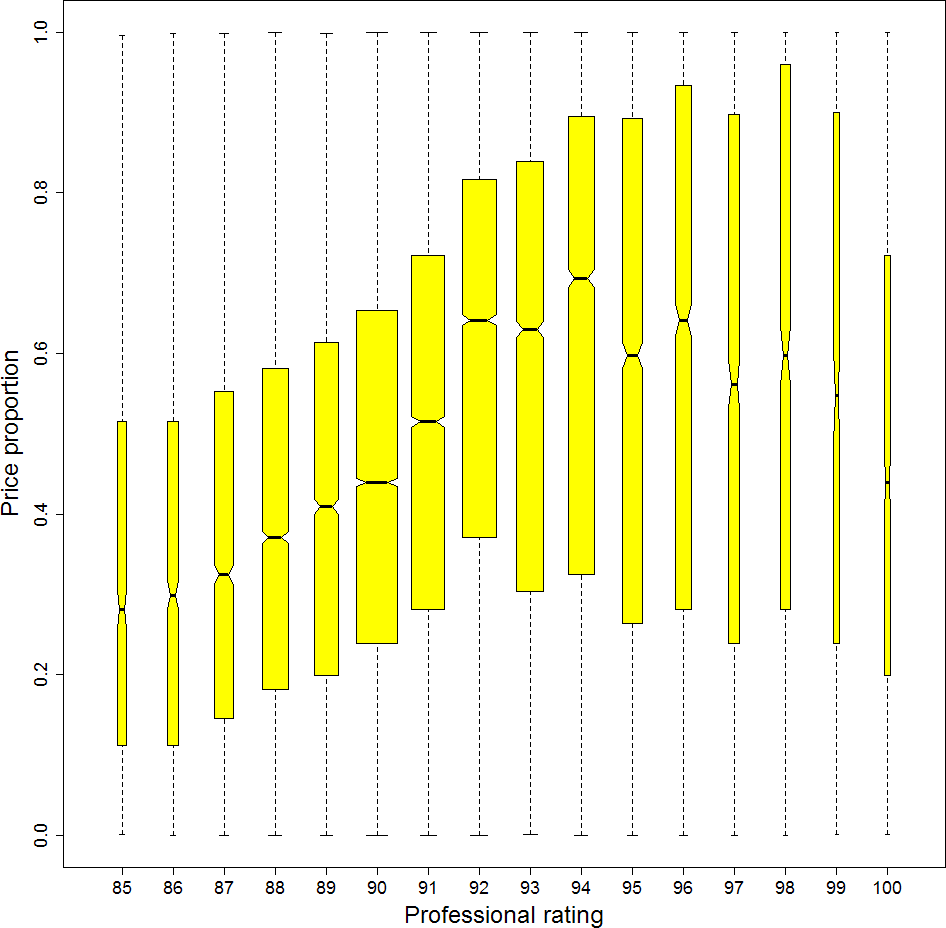
Here we see the same price data organized on the basis of professional scores. These have a bit more resolution, and we can see an interesting trend. While prices and average professional ratings tend to increase together in the 85-94 point range, median price actually decreases slightly with increasing score in the 95-100 range. This may suggest that to receive a truly outstanding score in the high 90s, a wine must be not only tasty but also undervalued - a diamond in the rough.
Correlations
The preceding graphs make it clear that wine prices and quality ratings are correlated. Measuring this more precisely using Pearson correlations, we can see that they are each correlated to a very similar degree: for community reviews, r = 0.25, and for professional reviews r = 0.24. Note that the nonlinearity apparent in the professional reviews makes the latter estimate something of an underestimate. So given that both measures of quality are modestly related to price, are they also related each other? The answer is largely no: the correlation between average community reviews and average professional reviews is a meager r = 0.08. This suggests that to the extent that community and professional opinion affect wine price (and remember that the direction of the causal arrow is far from certain here) they do so for different reasons.
There are a number of potential explanations for this. For example, perhaps consumers on Wine.com take professional reviews - which are of course available on the site - into account when scoring wines, and therefore give relative rather than absolute ratings. Another obvious possibility is that the qualities that appeal to wine experts and the average consumer simply differ. Hopefully in the future I'll have the opportunity to test the latter hypothesis by examining the effects of experience on preference. For the moment, however, given the low correlation between community and professional reviews we'll simply tackle each case separately.
Quality and descriptive language
Our primary goal here is attempt to decipher winemakers' notes for concealed or euphemistic signs of quality. Before we examine these highly controlled cases, however, let's take a look at some language that requires little interpretation: the text of consumer reviews. Unlike the company producing the wine, consumers have no particular incentive to moderate their candor: they can call it like they taste it. So what words do they use to describe good or bad wines?
This case will also serve as a simple example of the type of analysis we apply to tasting notes below. The process was quite straightforward. First using Python, I counted the frequencies of just over 2100 words within the consumer reviews for each wine. These words were selected as the most frequently occurring content words in the reviews. I then simply correlated their counts with average consumer ratings of the same wines. The words with the highest 1% and lowest 1% of correlations are shown in the wordcloud below, with their sizes scaled by the absolute values of said correlations.
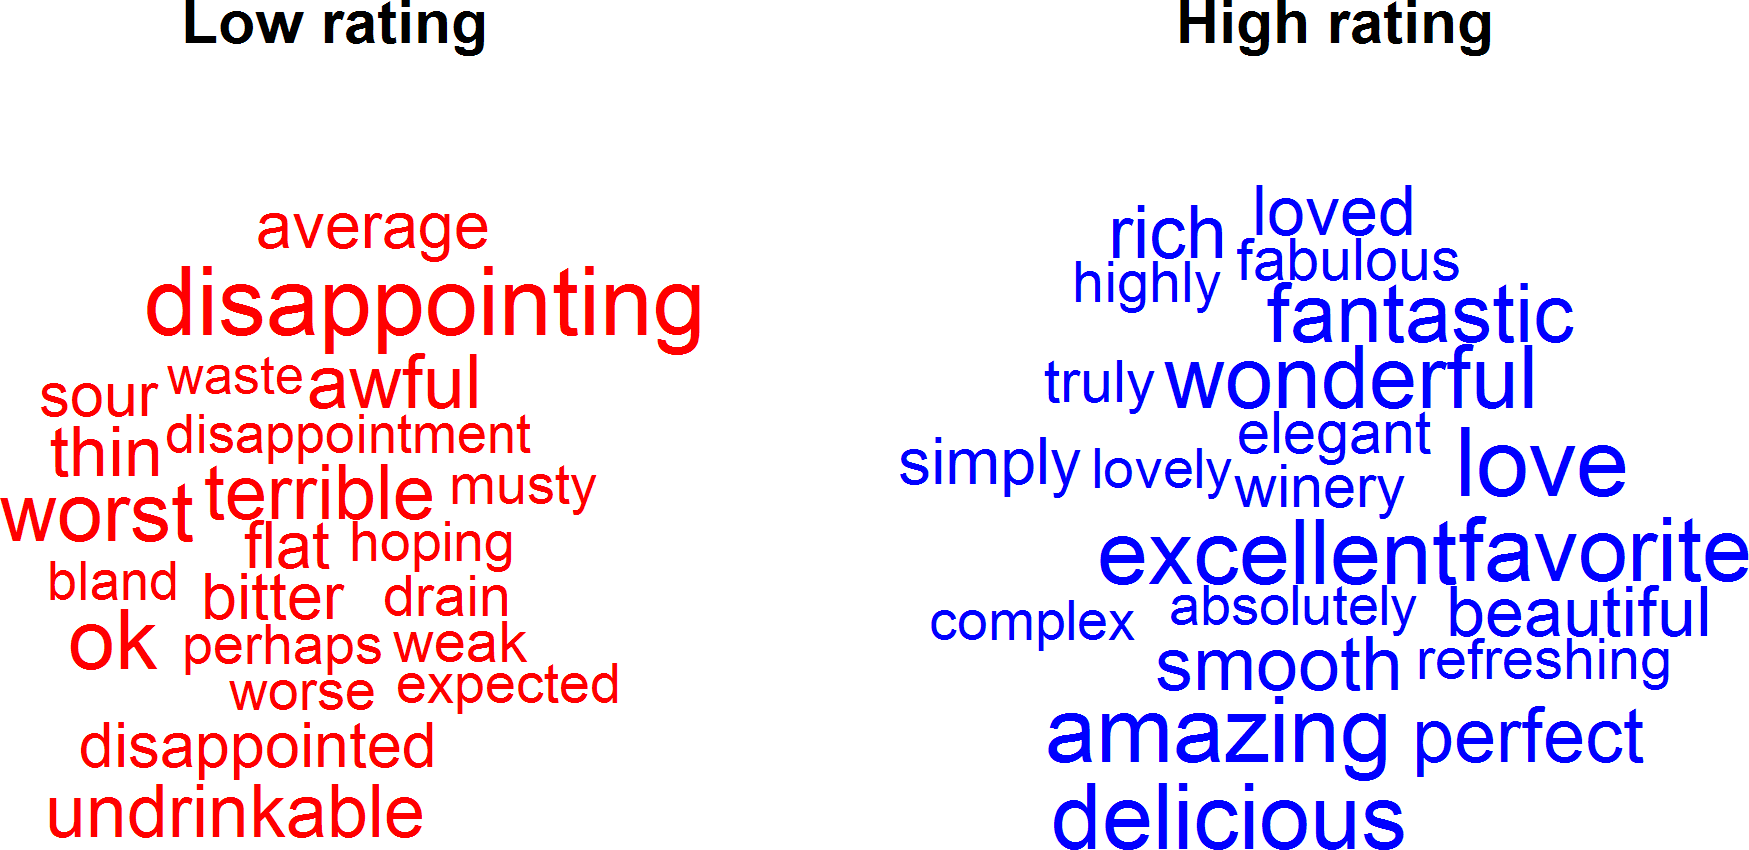
A cursory glance at these clouds reveals that consumers express their (dis)approbation for wines very directly. Most importantly, they actually use explicitly negative words to describe wines they did not enjoy. Unfortunately, it's very unlikely that wineries will be equally candid about their own poor products. In fact, if they are, they should probably look into a new marketing team! The next analyses use the same general approach to examine the words they might actually use to describe wines of particular quality (or lack thereof).
The back label and community ratings
The approach here was almost identical to that described above. The primary difference was the list of words examined, which in this case constituted just over 2600 words that occurred with high frequency in the winemaker's notes (rather than the 2100+ from the consumer reviews). The counts of these words were correlated with (in this case) average community reviews, and the words with highest and lowest correlations are plotted below. In this case, I split things up by white and red wine, since it was very plausible that different descriptors would emerge for each.
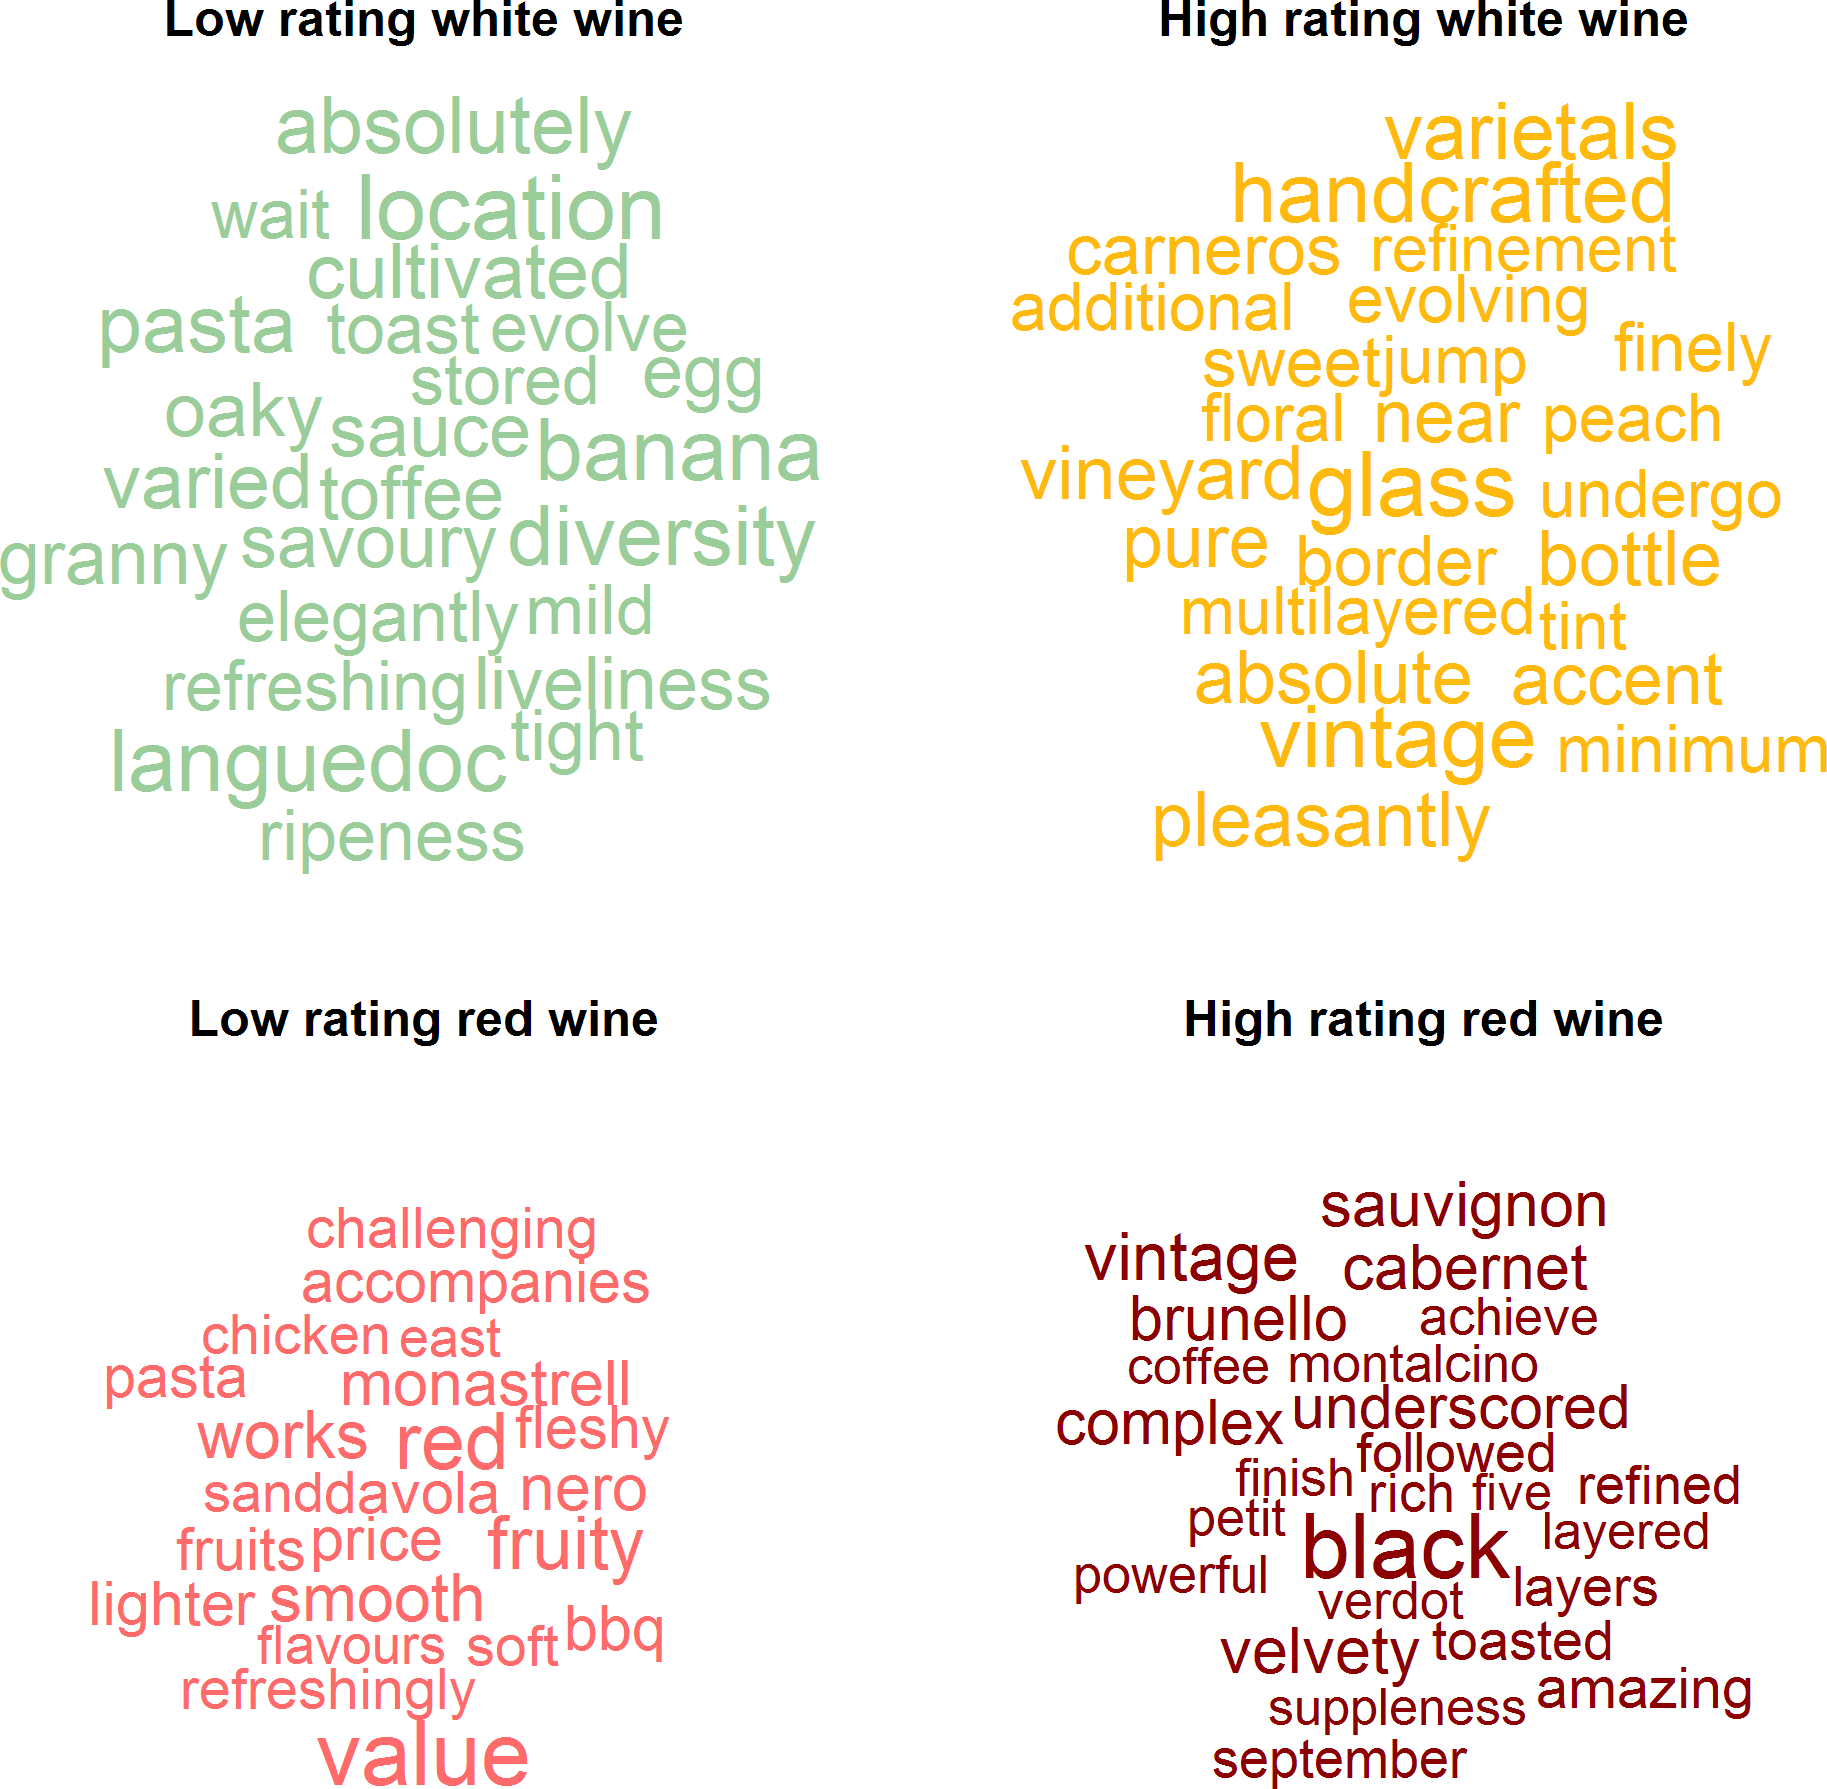
Both regional and varietal preferences make themselves clear in this analysis. For white wines, those that mention the Carneros appellation, which straddles Napa and Sonoma Valleys in California, tend to be highly rated, unlike those from Languedoc, a region in the south of France well-known for its contributions to the "wine lake". With regards to the reds, varietal seems to play a larger role, with Brunello di Montalcino, Petit Verdot, and Cabernet Sauvignon earning high marks. Nero d'Avola and Monastrell grapes, on the other hand, seem to yield less preferred wines.
More generally, using the word "location" seems to tip one's hat to a bad white wine, while mentioning "glass", "handcrafted", or "vintage" on the back label seems to indicate a better one. For reds, "value" is the word to avoid, whereas use of the word "black" (likely in the context of "black" fruit notes) is a good sign.
The back label and professional ratings
However, perhaps you don't care what a bunch of internet commenters think about wine - perhaps you want to use the experts as a guide. For this we turn to professional ratings. The analysis is exactly the same as in the previous case, except for the fact that we now correlate the frequency of word occurrences in the notes with average professional reviews instead of community reviews.
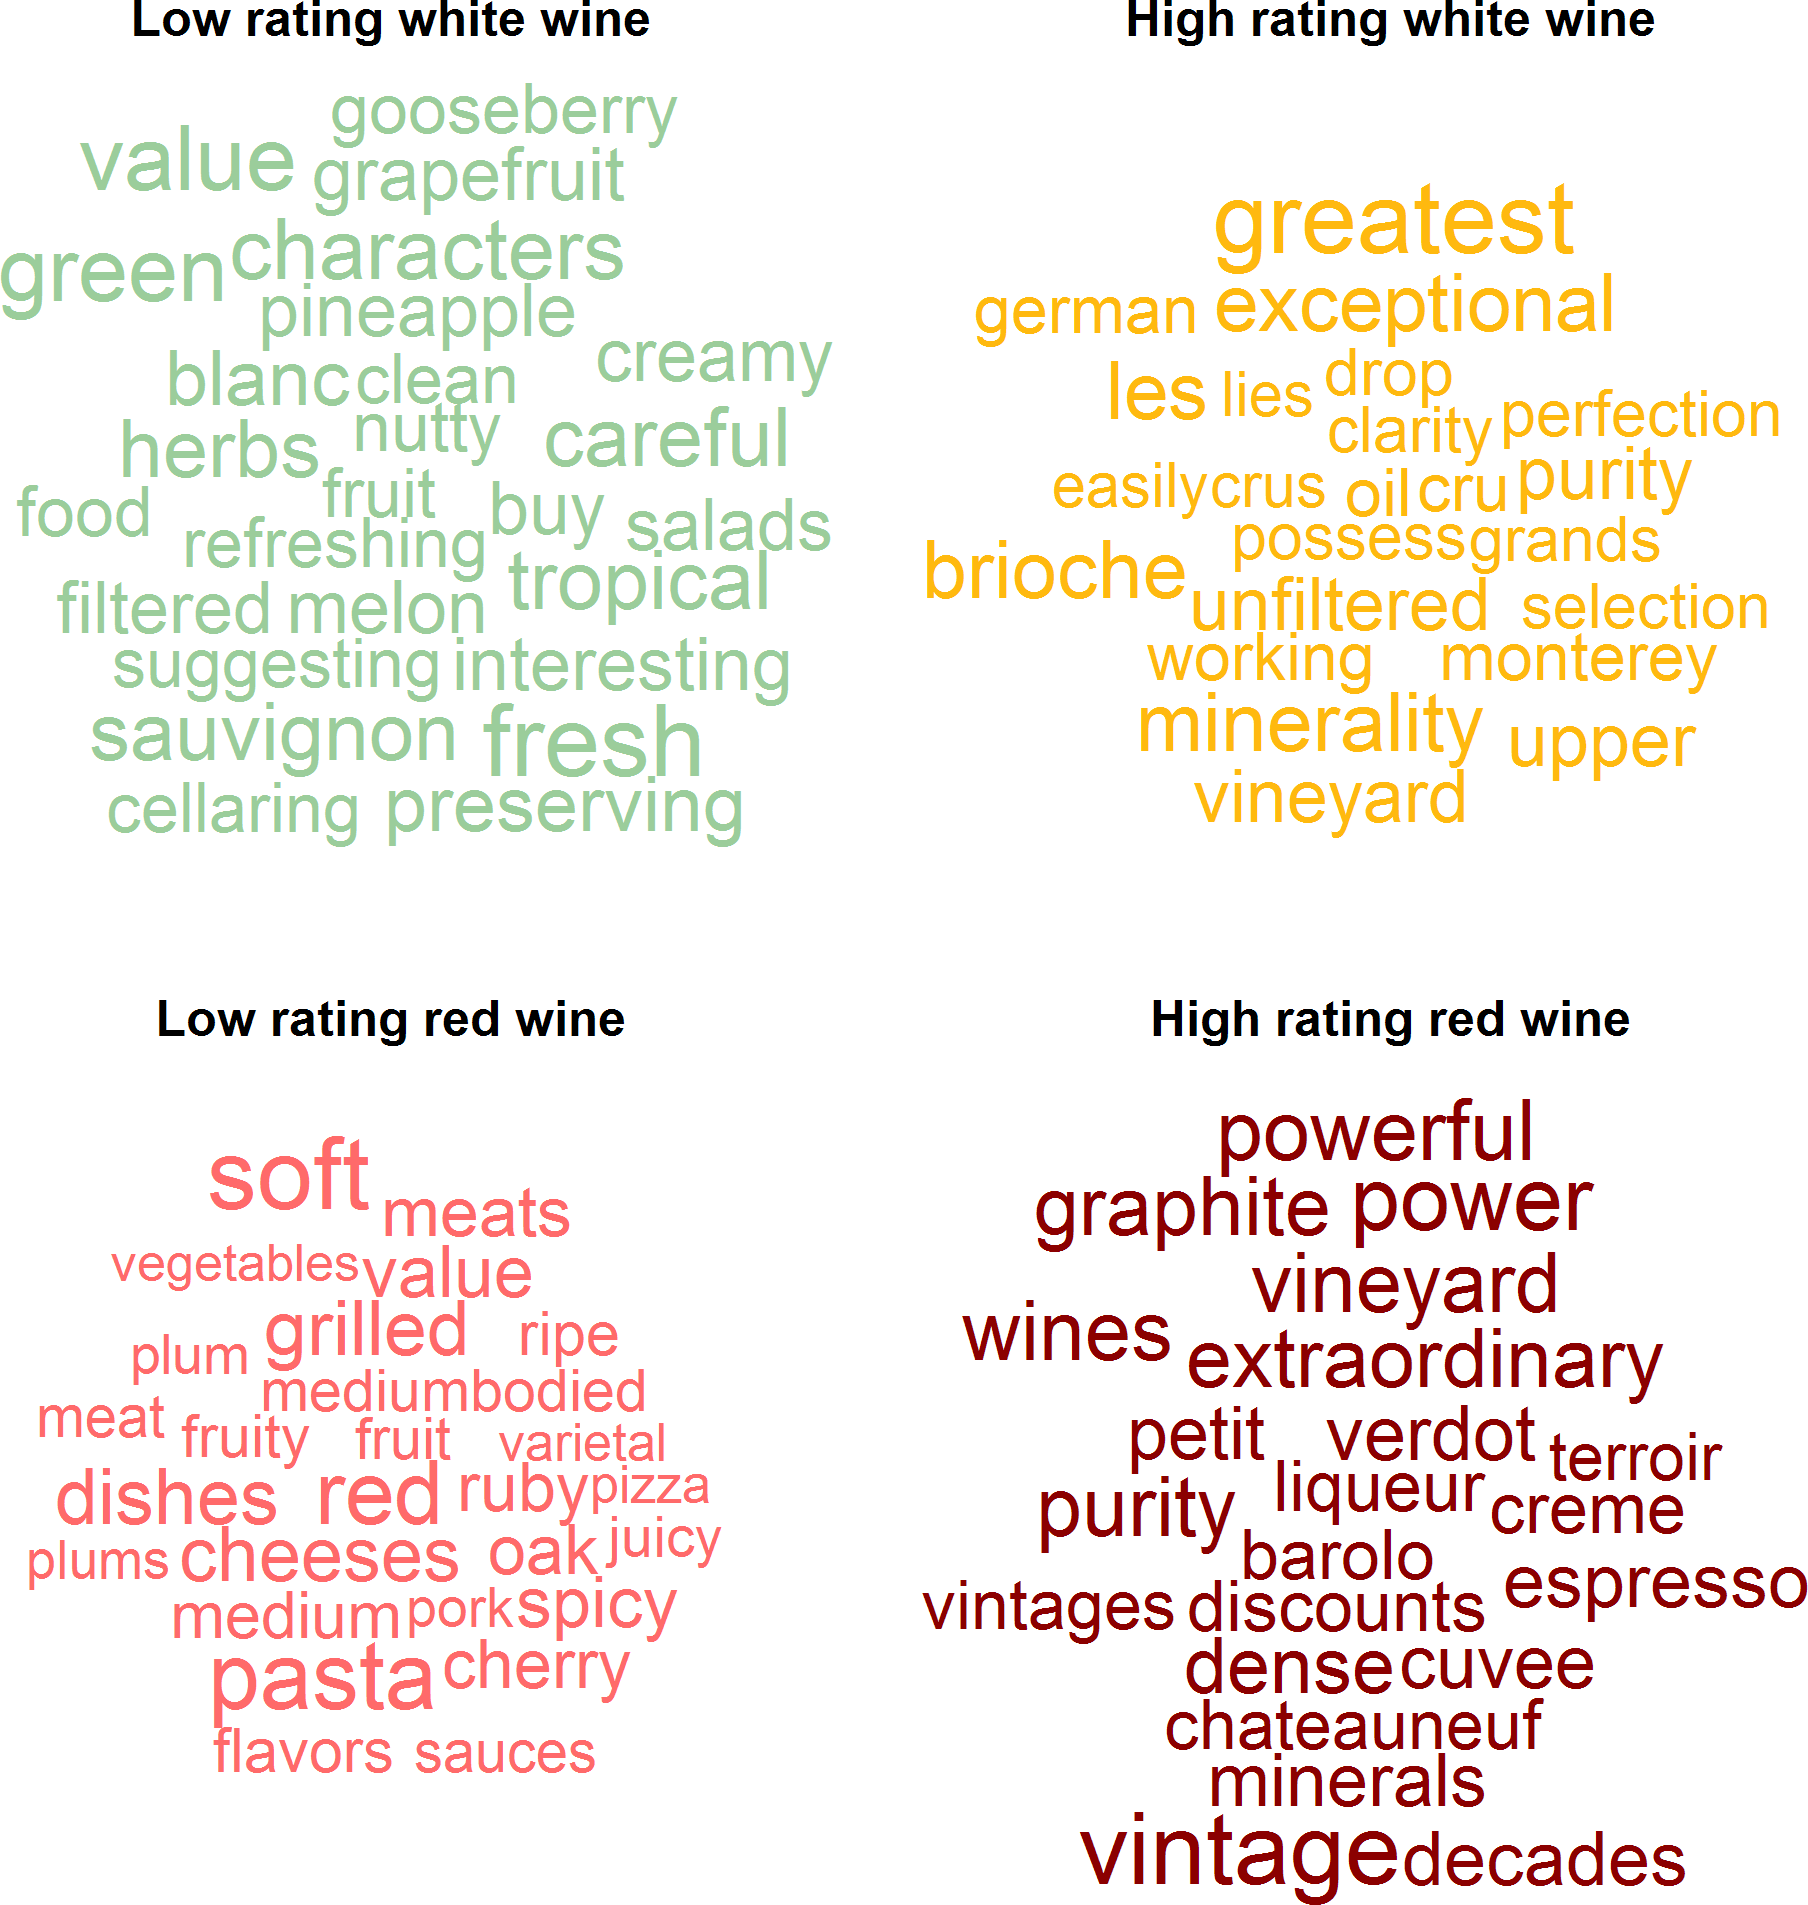
Both regional and varietal preferences make an appearance here too, but they aren't the same regions and varieties. Professional reviewers are clearly down on Sauvignon Blanc, since in addition to the name of this varietal appearing in the wordcloud, much of the cloud reads as a collection of canonical Sauvignon Blanc descriptors. Of course, this may reflect more about current trends in the industry than about actual taste - personally I love Sauvignon Blanc! The "good" white wines appear to come from Germany, Monterey, or judging by the frequency of the word "cru(s)", Burgundy. Many of the descriptors in this cloud are consistent, with "oil" (petrol?) characteristic of the German riesling and the "minerality" characteristic of white Burgundies both present. The very concept of "varietal" is apparently out of vogue for reds, though that doesn't stop experts from expressing a preference for Barolo and sharing consumer's liking of Petite Verdot. The French region of Châteauneuf-du-Pape also receives some love from critics for its reds.
As far as more generic descriptors are concerned, "fresh" and "value" appear to be back label indicators of professionally censured white wines. Highly rated white wines clearly don't struggle with modesty, since using the word "greatest" is their best predictor. Meanwhile "soft" "red"s should be eschewed in favor of "powerful" "vintage" bottles if you want to stay in good graces with your sommelier friends.
Conclusion: pasta: bad!
The common denominator of the back labels of bad wines appears to be mentioning "pasta." Pasta shows up in the bad clouds for both red and white wines in the consumer rating analysis and for reds in the professional rating analysis. Since I've never heard pasta used as a wine descriptor, I'm guessing this refers to food that winemakers recommend to accompany their wines. More generally, across all of the low rating wordclouds, it's clear that talking about what food to pair with the wine is bad sign. I don't think this trend emerges because wines that go well with food are inherently bad. Instead, I suspect it is a strategy by the wine marketers: when you don't have anything good to say about a wine, talk about what accompanies (and perhaps cloaks) it!
See the next post in my series on wine here.

© 2015 Mark Allen Thornton. All rights reserved.